How to Create a Grouped Table in Salesforce Einstein Discovery
What if you could predict outcomes of when and how your team will close sales opportunities? Salesforce offers an analytical tool that does just that. However, you have to prepare the data, and that means you must create a grouped table in Einstein Discovery (ED), the amazing Salesforce prediction tool.
So, what does that take? There are five steps to creating this data and various methods to group this data for building reports.
Let’s look at what this process looks like. Before doing that, let’s look at what Salesforce ED is and what reporting options this program offers.
What is Einstein Discovery?
Salesforce ED is an AI-powered analytics tool that discovers relevant patterns in data automatically without building complicated data tables. However, you must tell Einstein what information is relevant. You can do this by creating simplified grouped tables.
The datasets you want to analyze can come from various data sources. Once you load the data into ED, the tool creates a story of the customer journey and allows you to predict outcomes.
For example, you can predict when a sales opportunity will close based on historical data of patterns automatically detected by this powerful analytics tool.
That’s not all it can do. The above video helps you learn more about getting started with Salesforce ED.
When building tables to view data to make predictions, you’ll want to determine what type of insights your teams need to obtain from these reports and what their options are to obtain this data. Here are some Salesforce reporting options:
- Filtering: With this option, you can control what records your inquiry pulls back in the reports. For example, show only records of opportunities for a specific sales team.
- Grouping: If your team requires data based on a particular property, grouping tells Salesforce what records to look through for collection. For example, creating a grouped table based on the dates opportunities were created by your team.
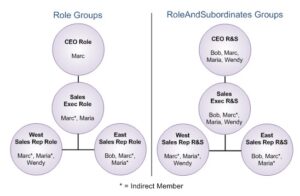
Subgroupings: You can also break data into stages. Using up to three groups you can apply settings to obtain insights. For example, you can create a grouped table as role groups, such as upper management. You can also group tables based on subordinate role groups, like those working under management groups on specific teams.
Salesforce Report Formatting: Building Table Groups
Machine learning (ML) can help you and your teams predict outcomes based on historical data. However, your CRM must organize this data properly, and for that, your grouped tables need proper formatting.
There are four types of report formats to choose from when building grouped tables. They are:
- Tabular
- Summary
- Matrix
- Joined
Once you have selected the format, you will need to prepare your data. Einstein Discovery is completely outcome-focused. That allows ED to analyze two kinds of outcomes, Binary (Yes/No, Win/Loss, True/False), and Numeric (Quantity, Time, Date, etc.).
Preparing your data is done in five steps to create grouped tables.
1. Identify Data
You must first identify where the historical data lives in your databases. You’ll use this data to train ED to identify patterns based on previous datasets.
That data is essential because ED will need to learn from the historical opportunities, including accounts, owner information, events, tasks, and/or team members.
2. Join Data
Predict when a sales opportunity will close by creating rows displaying individual opportunities. You can do this utilizing Einstein Analytics Recipes. That will merge parent objects like sales opportunity owners and accounts.
Child objects such as tasks, team members, and events will aggregate these values. The most straightforward approach is by creating separate datasets employing this transformation before joining them back into the opportunity dataset.
3. Choose Columns to Include
After you join objects together in your grouped table, you can choose to add a column (or several). They may not provide useful insights, so don’t add too many. However, if you aren’t sure whether the data from the field will be beneficial, add it, and ED will decide how useful the data will be to the insight you’re looking to obtain.
Here are a few helpful tips for creating these grouped tables:
- Avoid fields that are irrelevant to outcomes
- Select fields that don’t have unique values
- Be careful when selecting objects
4. Screen Data
When creating a grouped table, screening data will give you a better sense of opportunities that complete the sales cycle.
For example, if you filter your data in Opportunity by what has closed (IsClosed = true), you miss out on insights regarding these deals. Like whether the sales opportunity was won (IsWon = yes/no) and at what phase they ceased to move forward.
You may also want to include filters that segment audiences for insights to help drive engagement and determine marketing strategies.
5. Calculate Any Additional Data
With ED, you will need to create fields showing opportunities moving along the sales cycle. That includes data about when it was created and closed and every stage in between. That will allow ED to predict sales process time.
By including the sales opportunity owner, you will also gain insights on which team members close deals faster. That will assist management in determining who to award specific opportunities to and who could use more training on closing.
Learn More About the Features of Salesforce Einstein Discovery
Salesforce reporting features can help your teams get valuable insights to predict the best ways to move forward with an opportunity. Unfortunately, grouping this data to build reports can seem like a daunting task.
At Rainmaker, we help you learn how to integrate all the features Salesforce CRM has to offer. We have the expertise to help you optimize your data by creating grouped tables in Einstein Discovery.
Are you ready to learn more about how Salesforce Einstein Discovery can help your teams gain better insights on opportunities? Contact us today to see how we can help.


