Measuring customer satisfaction KPIs is more important than ever before. Customers today expect a personalized, often round-the-clock experience that includes high product or service performance, omnichannel customer support, and personalization in all interactions.
The connectivity of the world today has also made word-of-mouth marketing more prevalent and popular as consumers lean on online reviews and testimonials available at the click of a button. Companies must strive to provide an experience that keeps customers satisfied and increases the likelihood they’ll recommend the products and services they use.
Customer satisfaction KPIs give companies insight into how their customers perceive and feel about their products and services, allow for earlier identification of problems and concerns, and create opportunities for smarter and more proactive decision making.
Let’s take a closer look at 5 customer satisfaction KPIs every company should consider tracking.
5 Customer Satisfaction KPIs You Should be Tracking
Net Promoter Score (NPS)
Net Promoter Score (NPS) was first introduced in 2003 and is now by far the most commonly used metric for measuring customer satisfaction, according to Lumoa’s State of the Customer Experience Survey.
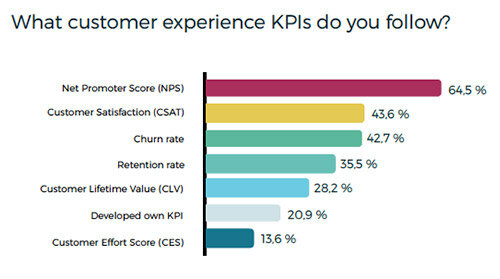
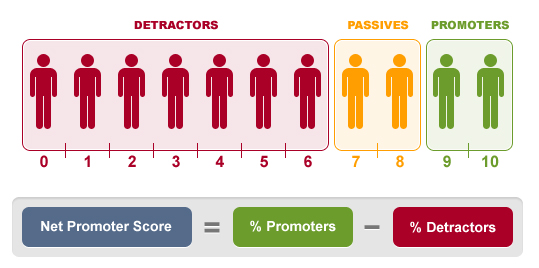
Two-thirds of Fortune 1000 companies currently measure their Net Promoter Score (NPS). It’s a simple way to track customer satisfaction by asking how likely a customer is to recommend your product or service on a scale of 1-10. Scores fall into three groups:
- 0-6 – Detractors
- 7-8 – Passives
- 9-10 – Promoters
To calculate NPS, break down the total responses by detractors, passives, and promoters. Then calculate the percentage each represents by dividing each group total by the overall number of responses. Then subtract the percentage total of detractors from the percentage total of promoters to get your final NPS score.
NPS is a powerful metric for companies to track because it’s an indicator of the likelihood of referrals and peer recommendations, which 92% of consumers trust, according to research by Nielson. It’s also simple to collect, track, evaluate and compare to competitors.
Customer Satisfaction (CSAT)
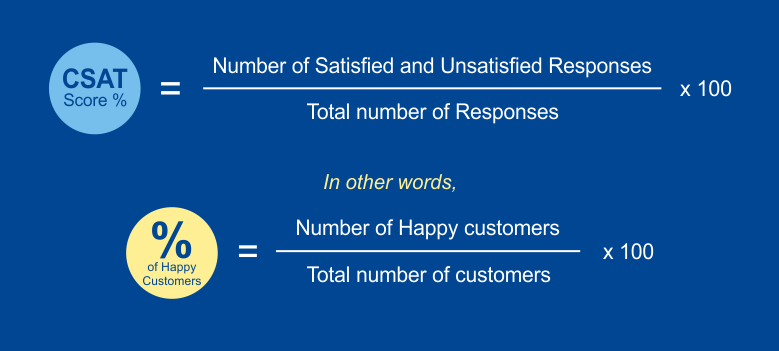
Customer satisfaction score (CSAT) is a way to understand how well customers feel a product or service has performed to meet their needs. It uses a defined 1-5 scale as follows:
1 – Very unsatisfied
2 – Unsatisfied
3 – Neutral
4 – Satisfied
5 – Very satisfied
Like NPS, benefits of CSAT include its simplicity in both collection and measurement. CSAT is ultimately calculated as a percentage. Finding the percentage of satisfied customers requires totaling all 4 (satisfied) and 5 (very satisfied) ratings, dividing it by the total number of survey responses, then multiplying it by 100. The same can be done to find the percentage of unsatisfied customers using all 1 and 2 ratings.
Customer Retention Rate (CRR)
Customer retention rate (CRR) measures the percentage of a company’s existing customers that they retain over a specified period of time. Understanding retention rates is critical as research has shown that acquiring new customers is much more expensive than retaining existing ones.
Customer retention rate also gives companies a glimpse into customer loyalty levels and ultimately how happy customers are with their experience, assuming that renewals, additional purchases, and/or continued engagement are all signs of satisfaction.
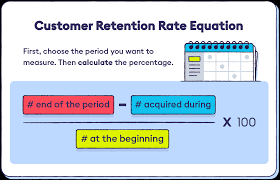
Calculating CRR requires the collection of three key data points:
- The number of existing customers at the start of the specified time period (S)
- The number of total customers at the end of the specified time period (E)
- The number of new customers acquired during the specified time period (N)
To calculate, subtract the number of new customers (N) from the total number of customers at the end of the time period (E), then divide that number by the number of existing customers at the start (S) and multiply by 100.
Churn Rate
Customer churn is the opposite of customer retention. If customer retention rate measures loyalty by identifying the percentage of customers who stick around, churn measures dissatisfaction by identifying the percentage of customers who stop doing business with a company. Like retention rate, churn is measured for a specified period of time.
Customer churn directly impacts a company’s bottom line because lost customers means lost revenue. It’s an important metric to track so companies can know right away when there are increases in churn rate, identify problems or reasons behind it, and take action to solve them.
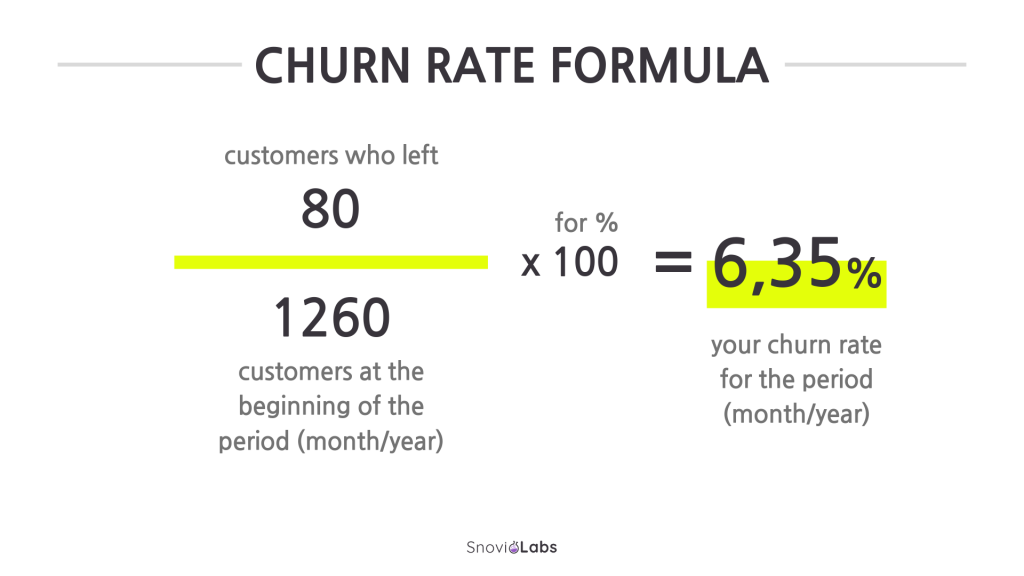
Churn rate can be calculated by identifying the number of customers at the start of the specified time period and the number of customers lost during the specified time period. Divide the latter by the former, then multiply by 100 to get your final churn rate.
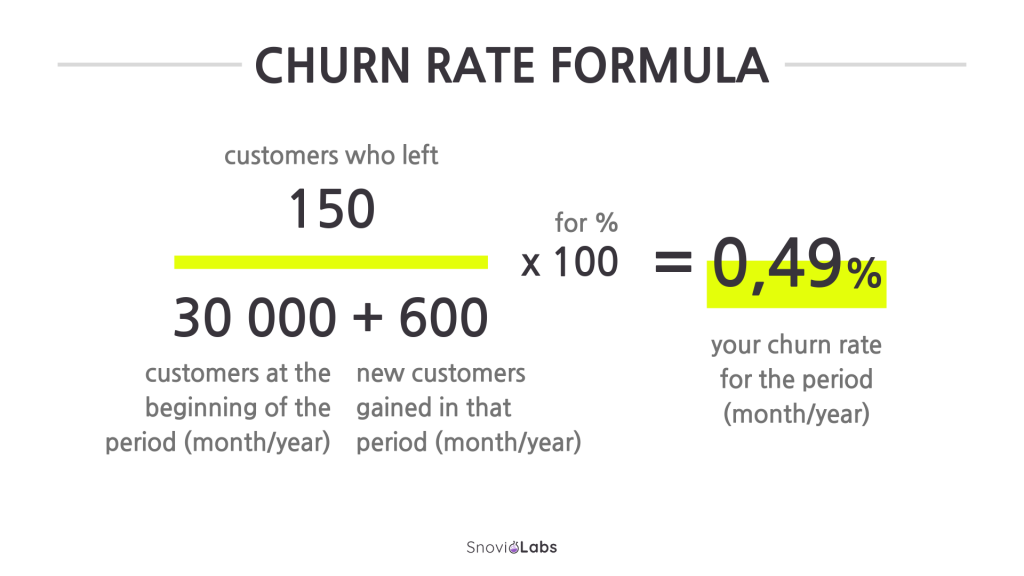
Alternatively, some companies will take into account the number of customers gained during that same specified time period and add them to the denominator as follows.
Customer Lifetime Value (CLV)
Customer Lifetime Value (CLV) aims to calculate how valuable a customer is to a company from a revenue and relationship perspective. Knowing and increasing the value of your customers over time drives revenue and growth. CLV is a great metric to measure with customers you have long-term (typically multi-year) relationships with.
Calculating CLV is not as straightforward as other customer satisfaction metrics and thus many companies shy away from trying to calculate it all. But those who do it well gain valuable insight into their customer relationships, can spot trends in customer behavior, and improve the overall customer experience they provide.
Qualtrics recommends that CLV be calculated by first taking the following four factors into account:
- Identify the customer touchpoints where value is created
- Integrate records in order to understand the customer journey
- Measure revenue generated at each customer touchpoint
- Add together over the lifetime of that customer

To actually calculate a CLV number, you can multiply the customer revenue per year by the duration of the relationship in years, then subtract the total customer costs (both acquisition and service). This formula works best in situations where rates are likely to remain constant over time.
But real-life customer relationships tend to be a bit more complicated, and there are ways to account for that with a formula that’s a bit more involved. Many companies take additional factors into account like gross margin per customer lifespan (also known as GML and referring to the profit you expect to make from a customer over the entirety of your relationship), retention rate, and inflation like in the example below.

Enhance Your Customer Satisfaction Insights
Salesforce empowers companies to maintain a high level of insight into their customer journey, relationships, and touch points throughout the relationship. Rainmaker Cloud can help you create customized Salesforce solutions that specifically move your organization toward its sales goals.
To learn more and get started, reach out to us today!